Overview
We systemically update our 3DSNP server. We systemically annotated SVs from a full spectrum of functions, especially their potential effects on three-dimensional chromatin structures. We also evaluated the chromatin accessibility surrounding the variants in a variety of tissues at the single-cell resolution. At last, we updated all the major contents of 3DSNP, including Hi-C, dbSNP and expression quantitative trait loci (eQTL).
NEW FEATURES AND CONTENTS UPDATE
Functional annotation of structural variation
To annotate SV, we first obtained a total of 107,590 SVs from the Human Genome Structural Variation Consortium (HGSVC v2). All these SVs were robustly identified using fully phased genome assemblies. Similar with our SNP annotation strategy, SVs were systemically annotated from a variety of aspects, including 3D interacting genes, expression quantitative trait loci (eQTL), chromatin state, transcription factor binding site (TFBS), sequence motif altered and evolutionary conservation. We calculated the linkage disequilibrium (LD)-associated SNPs and SVs of the query SV using the HGSVC SVs genotypes called from the 1000G project samples. Notably, the SV-eQTLs were identified by HGSVC using the transcriptomes of 427 donors and tested all SVs around the genes within a window of 1 Mbp. To generate a functional overview of SVs, each SV is scored based on its annotated records on six functional categories: 3D interacting genes, enhancer state, promoter state, transcription factor binding sites, sequence motifs altered and conservation score.
Especially, the new platform enables the measurement of the potential effects of SVs on local chromatin architecture. Using a published algorithm focusing on the prediction of the chromatin architecture alteration by SVs, we calculated three different sets of chromatin loops genome-wide for each Hi-C map of the 49 cell types:
i) the normal chromatin loops without considering any SV in the genome (e.g. track: H1-ESC),
ii) the altered chromatin loops considering all possible SVs located in the same topologically associating domain (TAD) at the population scale (e.g. track: H1-ESC_mod), and
iii) the altered chromatin loops considering only the presence of the query SV, to block any interferences from adjacent SVs (e.g. track: H1-ESC_mod_target), as show in Figure 1.
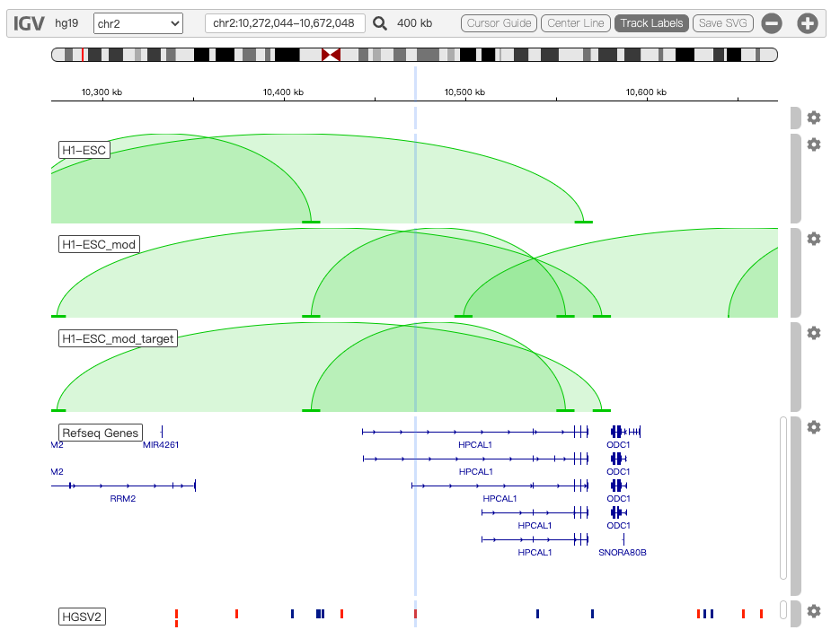
Figure 1
Annotation of SNP or SV target cell types/subtypes using scATAC-seq data
A measurement of local chromatin accessibility at the single-cell level will greatly facilitate the determination of functional target cell types/subtypes of a genetic variant. As a result, we collected two publicly available scATAC-seq datasets, including 53 scATAC-seq samples from 15 human fetal tissues and 70 samples from 25 adult tissues, respectively. For the fetal scATAC-seq dataset, a total of 1,001,437 ATAC peaks were identified genome-wide in 86,685 single cells, which were classified into 126 cell types/subtypes. The nearest ATAC peak (if any) within a 100 kb window surrounding a query SNP or SV was derived and its accessible states across all the cells were plotted using the Uniform Manifold Approximation and Projection (UMAP) (Figure 2). One can easily identify the target cell types/subtypes of the queried SNP or SV by looking up cell clusters with highly accessible chromatin states. For the adult scATAC-seq dataset, a total of 756,414 open chromatin regions termed as cis-regulatory elements (cCREs) were obtained in 472,373 single cells, which were classified into 54 cell types/subtypes. Since the raw peaks × cells matrix is not available yet, we used the average cCRE score of each peak across cells within the same cell type/subtype. For each SNP or SV query, the potentially functional cell types were sorted based on the accessibility scores of the cCREs overlapping the variant.
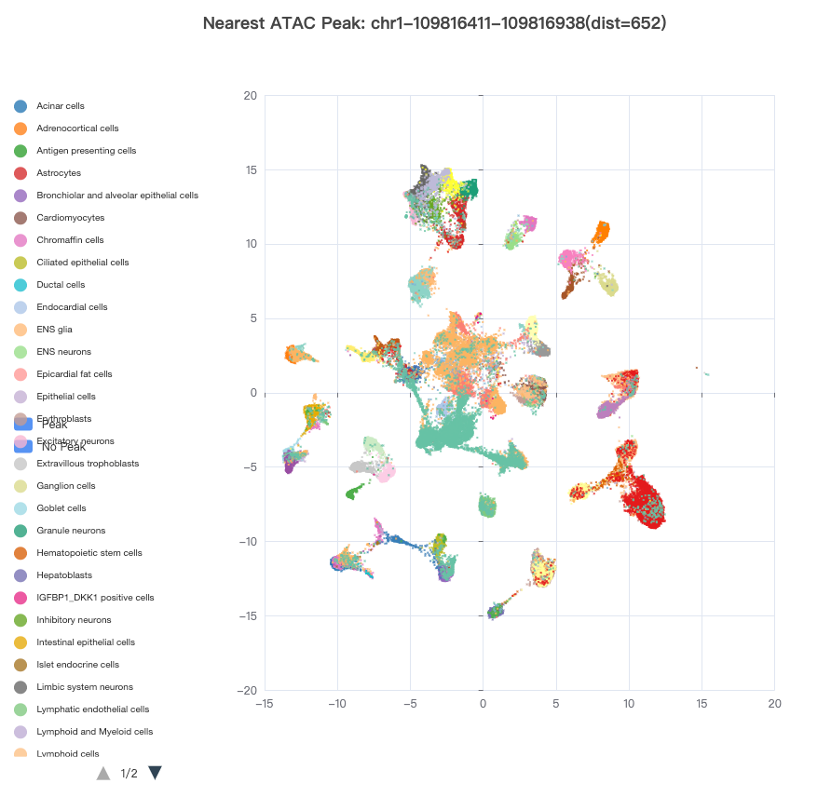
Figure 2
Population genetic statistics
With our better understanding of multi-variant adaptation, recent studies discovered that SNPs and SVs could jointly participate in the evolution of the genome and contribute to environmental adaptation. In order to avoid recombination with maladapted genomic backgrounds, candidate adaptive variants discovered so far often occurred in non-coding regions. Combing SNP genotypes from 1000G and SV genotypes from HGSVC, we searched for positive natural selection signals among the five major populations (AMR, EAS, EUR, AFR, and SAS). Population genetic statistics were calculated between each population and the others, including fixation index statistics (FST), integrated haplotype homozygosity score (iHS) and cross-population number of segregating sites by length (XPNSL).
Contents update
Additional cell types/tissues with Hi-C data. The number of available cell types with Hi-C data increased from 12 to 49, so that substantially more 3D interacting genes can be identified for a query variant in the updated version.
Latest dbSNP version. dbSNP database was updated from version 146 to 154, with the number of annotated SNPs increasing from 149,254,102 to 700,385,017.
Latest GTEx 3database. GTEx database was updated from version 6 to 8, with the number of significant SNP-gene pairs increasing from 19,582,729 to 71,478,528.
INTERFACE
New interactive interface for visualizing chromatin architecture and accessibility
Former version of 3DSNP has provided a series of user-friendly interfaces for the users to search, browse, visualize and export the results. To facilitate the visualization of the local chromatin architecture and accessibility surrounding the query SNPs or SVs, we used IGV.js plugin to replace the former USCS genome browser screenshot, as shown in Figure 3. Five major annotation categories are integrated in this visualization platform: basic annotation, Hi-C loops, scATAC-seq, variants, and population genetics.
(i) Basic annotation class include: RefSeq genes, DNase sites and RepeatMasker;
(ii) Hi-C loops class include: the normal loops (e.g. H1-ESC), the altered loops by all SVs (e.g. H1-ESC_mod) and the altered loops only by the query SV (e.g. H1-ESC_mod_target) in 49 human cell types;
(iii) scATAC-seq class include: averaged chromatin accessibility profiles of 126 cell types/subtypes in 15 fetal tissues;
(iv) Variants class include the dbSNP and HGSCV2 databases;
(v) Pathogenicity class include ClinVar and ClinGen.
(vi) Population genetics class include FST, iHS, and XPNSL;
Users can easily select interested tracks by clicking the Track Selector button at the bottom of the tracks.
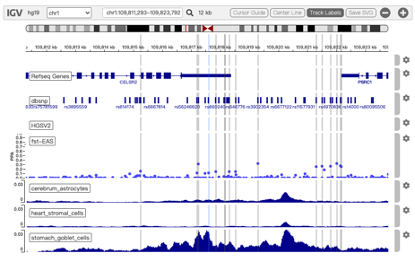
Figure 3
Data format
Query format
In addition to SNP ID(s), now we could search SV ID(s) in our database like chrN-start-SVtype-SVlength. It is worth noting that we used the naming of SV IDs from HGSVC. The SV IDs in HGSVC is defined in GRCh38 which is different from the position information we provide in the main table (GRCh37). In order to easily find SVs from HGSVC, we didn’t change the naming for SV IDs.
In addition, we also extracted some highly reliable SVs detected by short-read sequencing from the ClinVar. The naming of these SVs is consistent with the positions in GRCh37. Therefore, we recommend researchers search SVs by genomic regions. Target SVs in the region will automatically appear at the top of the main table.
Other annotations could be found in the previous version.